5 Recommended Tools for Optimizing Performance in ReactJS
My top favorite tools for monitoring and optimizing my React components.

In the spirit of speed and optimization, let’s jump straight to my list of favorite tools for performance monitoring and optimization for React.
1. <Profiler />
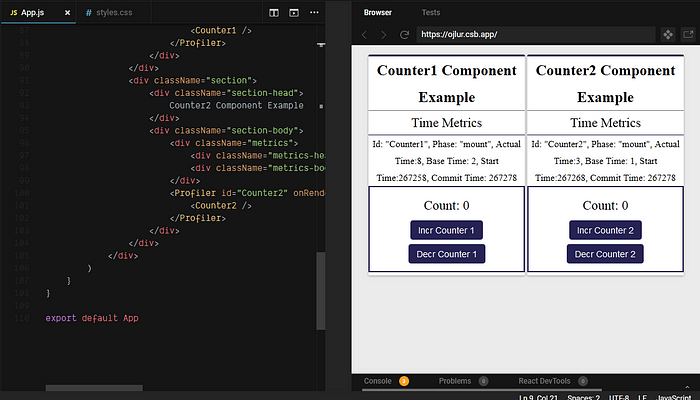
Profiler, a new component in React, developed by B. Vaughn offers a way to measure how many times your components get re-rendered and how much time and resources that rendering takes. Profiler takes a function prop onRender that receives time metrics whenever a component (wrapped by the Profiler component) is mounted or updated. It is a great way to inspect and detect inefficiencies in your React apps.
Here’s a simple example:
import { unstable_Profiler as Profiler } from "react"<Profiler id="Counter" onRender={callback}>
    <Counter />
</Profiler>
The id prop is used to id the Profiler that is reporting. The onRender callback function will be called with the below args when the Counter component is mounted or updated.
function callback(id, phase, actualTime, baseTime, startTime, commitTime) {

log("id: " + id, "phase:" + phase, "actualTime:" + actualTime,   "baseTime: " + baseTime, "startTime: " + startTime, "commitTime: " +  commitTime)}
The function’s arguments are time metrics taken from the rendering of the Counter component. Let's inspect each of them:
id: The unique ID that was set on theProfilercomponent.phase: This will report whether the component is in its "mount" phase or "update/re-render" phase.actualTime: The time it took the Profiler to mount or update its descendants.baseTime: The time it took each individual component in the Profiler tree to mount or update.startTime: The time the Profiler started measuring the mount/render time for its descendants.commitTime: The time it took to commit an update.
These parameters will help us identify which component tree is slowing us down and which is high performance.
My demo project
I created two components Counter1 and Counter2. I wrapped them each in a Profiler component with ids “Counter1” and “Counter2” respectively. I displayed the time metrics of each component in the DOM, so you can clearly see the time it takes for each component to mount or update. Give it a try 🙂
2. React Developer tools
‘React Developer tools’ is a DevTool extension built by the React team. It surely needs no introduction but there’s one feature I’d like to bring to your attention — the “Highlight Updates”. That’s a great feature for tracking which component gets re-rendered. It does this by coloring the boundaries of components… whenever they are re-rendered.
Let’s say you have a component tree like so:
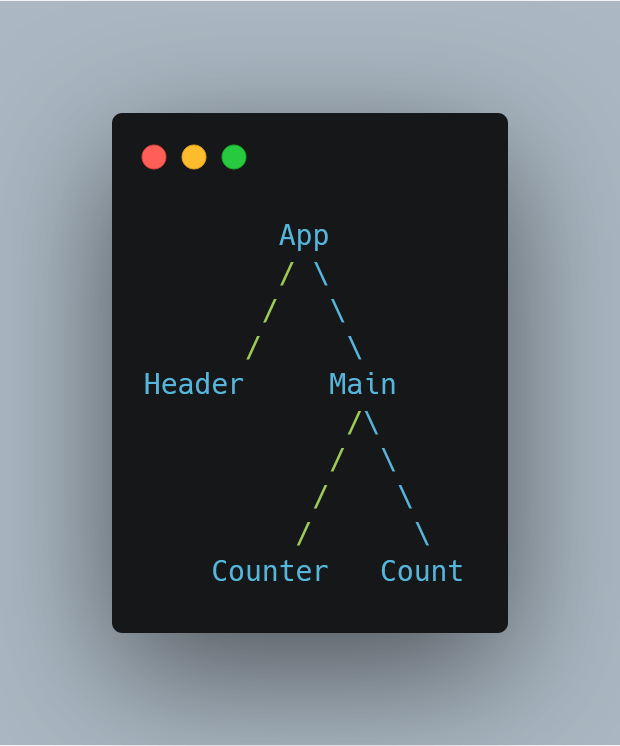
If Main re-renders, the boundaries that encapsulate the Counter and Count components will be briefly colored with a color highlight.
To activate this feature, go to your DevTools and click on the “React” tab. Click on a settings icon on the top right. A popup will appear. There, click on the “Highlight Updates” checkbox.
The type of color band that appears depends on how often/frequent a component is re-rendered.
|    green - low frequent update
|    blue - average frequent update
v    red - denotes a very frequent update
With this tool, we can track and easily identify by colors which component frequently updates and apply the necessary optimization to it.
3. Bit.dev
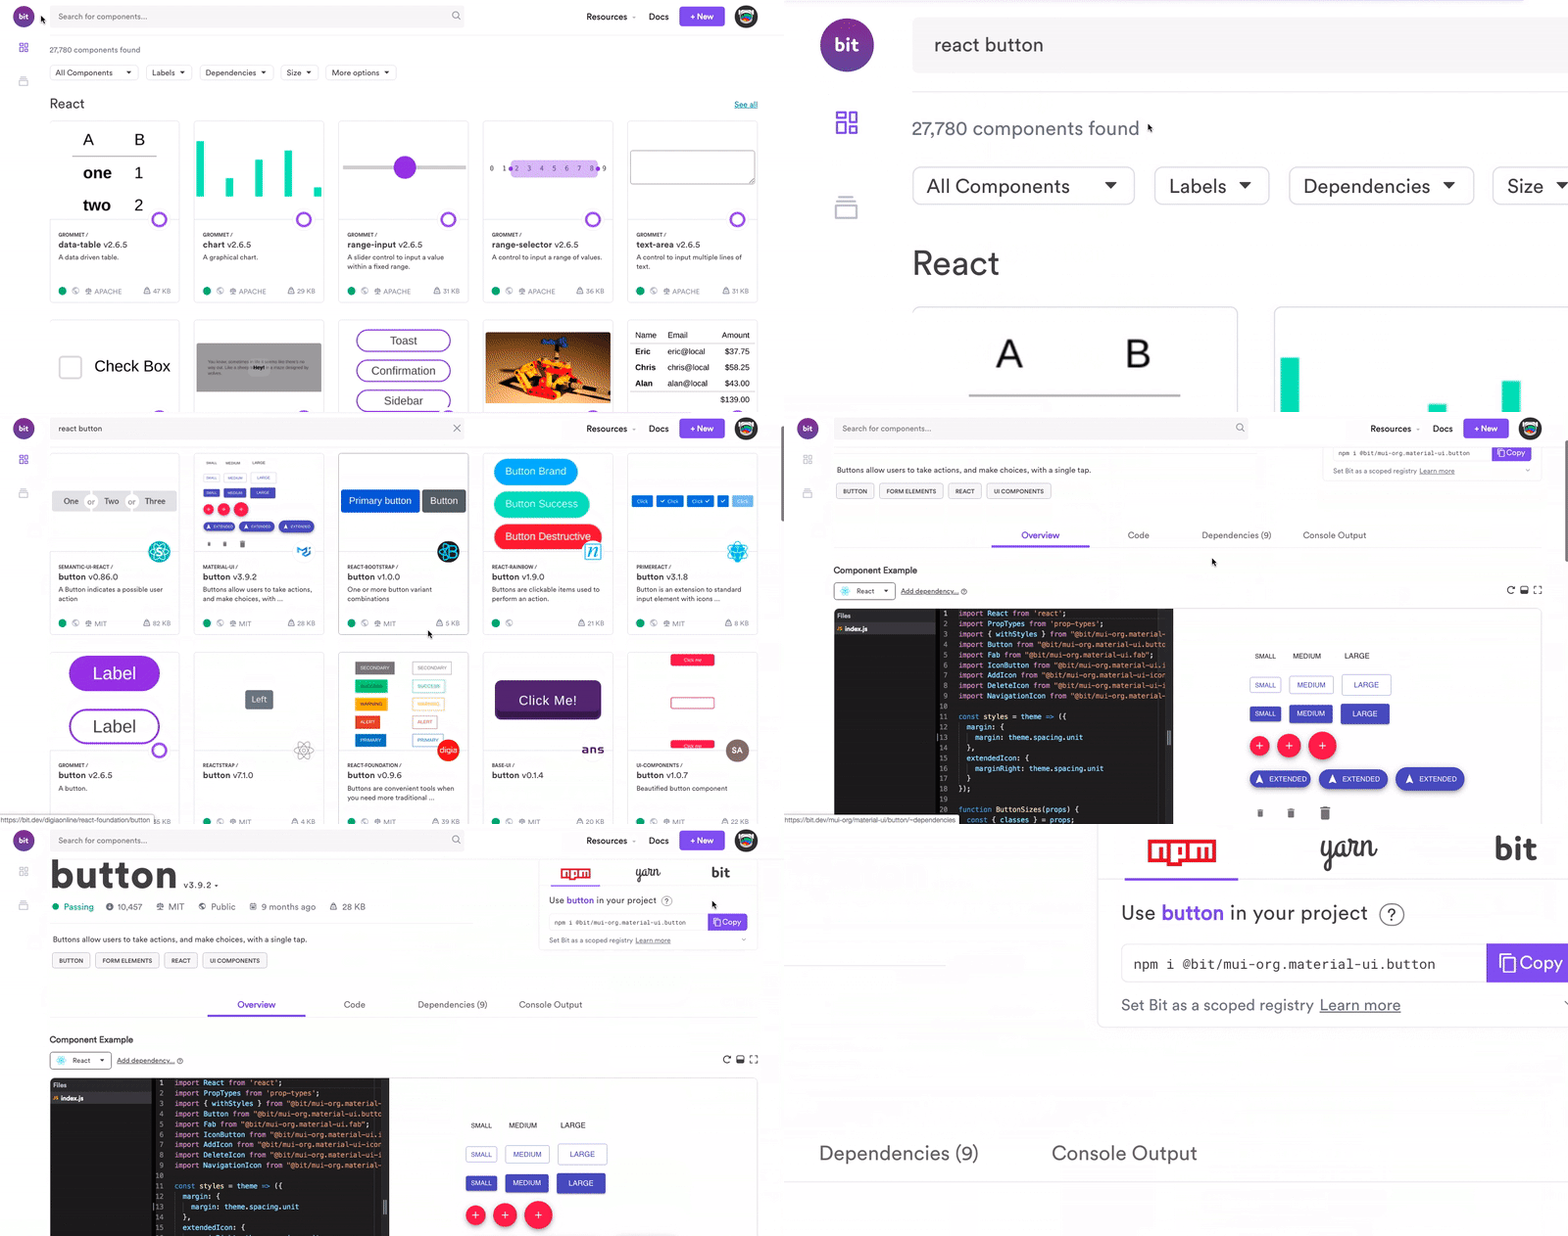
Bit is a great tool for sharing, organizing and reusing components. I use it with my team to publish and organize our performance-optimized components to a shared collection (at bit.dev), for future reuse. This way we make sure we both build using best practices and speed up development by maximizing code reuse.
Another key value, in terms of performance optimization, is quite simply using only what you absolutely need — a component, not a complete library. That’s especially crucial when working with 3rd party libraries.
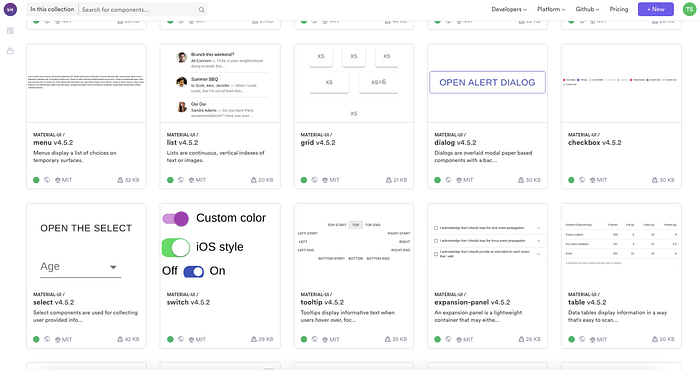
For example, if you’d like to use a component from the popular Material-UI library you’d have to install all of it. But, when you share the components to bit.dev, you can choose and use any independent component in your app.
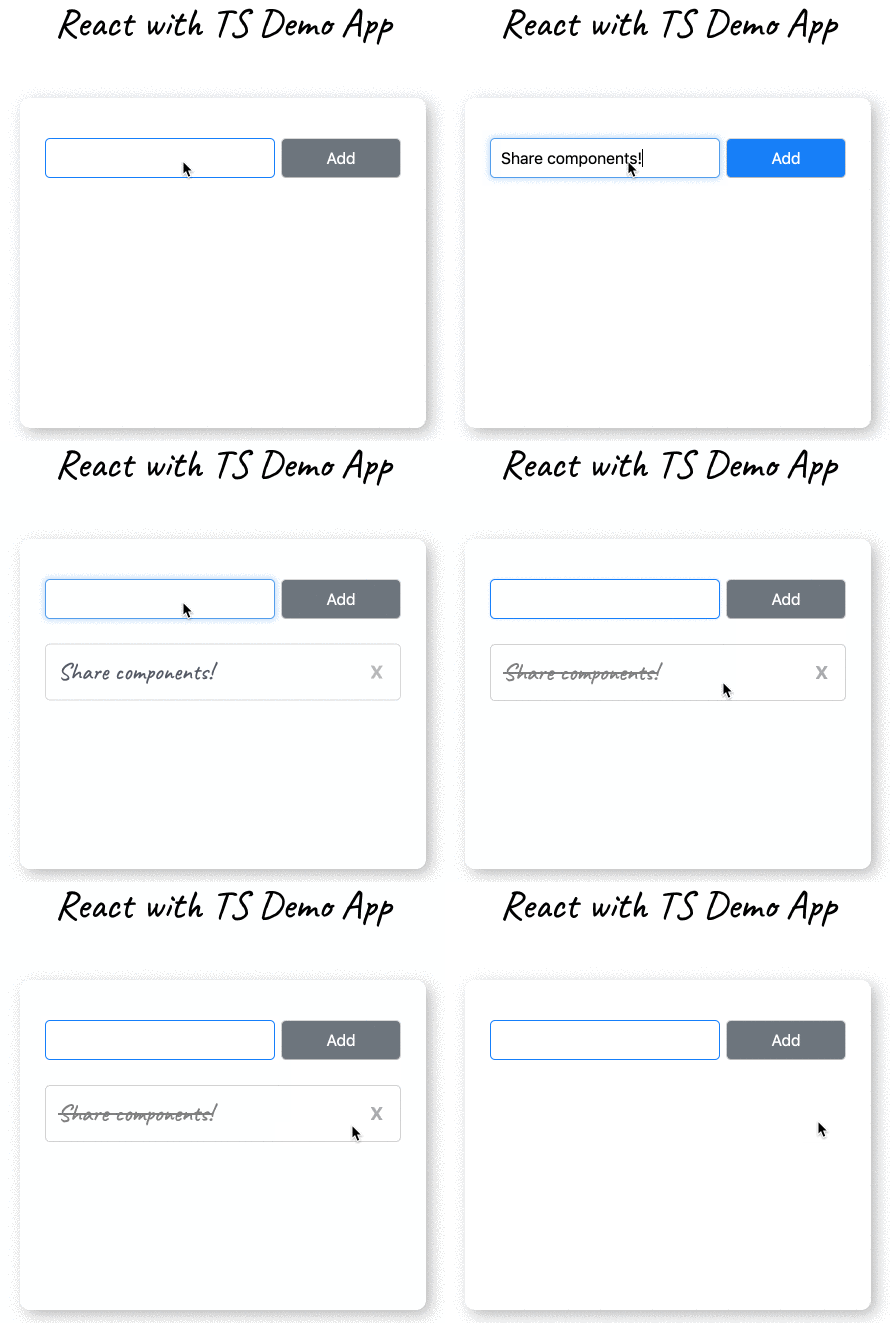
Here’s a short example for sharing components from a very simple to-do app:
First, you’d need to create a component collection in Bit.dev.
Then, install Bit’s CLI tool globally and login
$ yarn global add bit-bin$ bit login
Then, go to your project and start sharing:
// Initialize a workspace in your project’s directory$ bit init --package-manager yarn
// Add components to track$ bit add src/components/*
// Configure a compiler to make the usable in other build setups
// I use here the React with TypeScipt compiler$ bit import bit.envs/compilers/react-typescript --compiler
// Tag your added components (this will also build and test them)$ bit tag --all 1.0.0// Export them to your component collection at bit.dev$ bit export <user-name>.<collection-name>
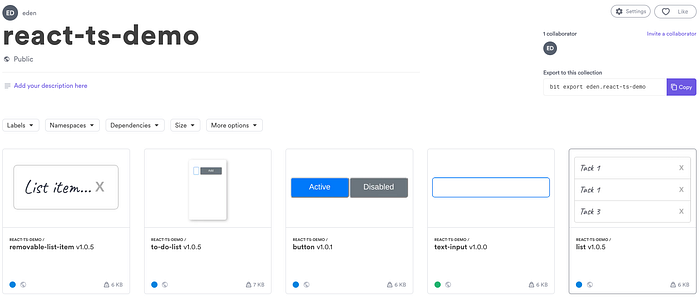
Here’s the final product — a shared collection of all this app’s components
4. why-did-you-render
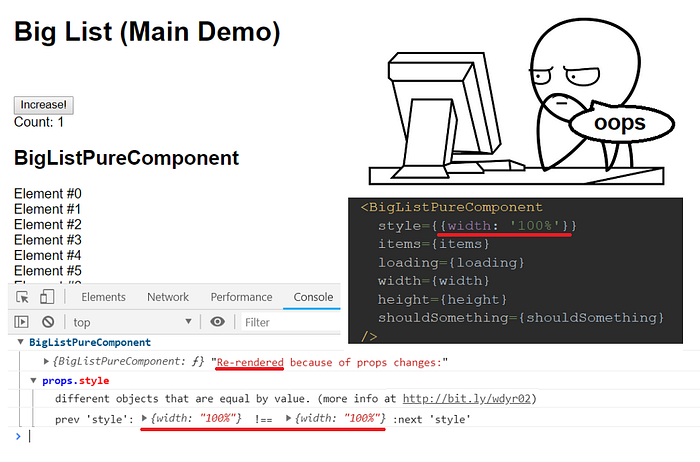
Built by Welldone Software, this tool gives feedback on wasted re-renders.
It performs a diff on the component's props and alerts you in the console if the props did not change despite the component being re-rendered when a component re-rendered even though the props have not changed.
Redundant re-rendering might not be noticeable in small apps, but would surely be felt when on larger scales.
This tool actually hooks into React to follow the component’s lifecycle, so it can perform the diff on the component’s props when they re-render.
It is quite easy to use. First, install it via npm install @welldone-software/why-did-you-render --save. Next, manually set the static whyDidYouRender property on class components like this:
class Counter extends React.Component {
  static whyDidYouRender = true;
  render() {
   //...
  }
}
For function components:
function Counter() {
  return(
   // ...
  )
}Counter.whyDidYouRender = true;
5. Performance timeline (Browser profiling)
This tool is built in the Chrome DevTools. You’ll find it in the Performance tab.
It is particularly useful for visually identifying components that are egregiously re-rendering. It is very helpful in identifying parts of the UI that updates unnecessarily and how often it occurs.
To use that tool, first, serve your React app in development mode.
Load the app in your browser by navigating to localhost:3000.
Open your DevTools, click on the “Performance” tab, if there is nothing like that, you will see “Timeline”, click on it. It is the same as the “Performance”.

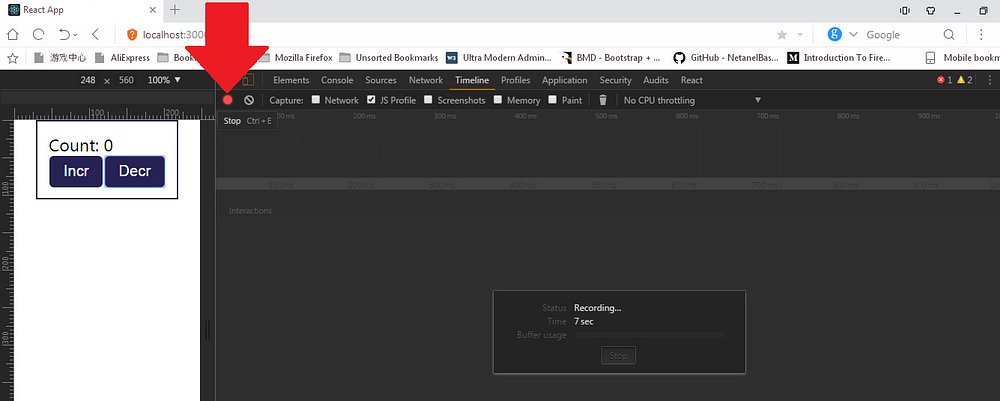
Now, click on the “Record” button or “Ctrl + E”, this will cause the DevTool to start recording. Interact with your app in a way you want to profile.

It is advised to record for 20 secs ’cause above 20 secs will hang your Chrome browser.
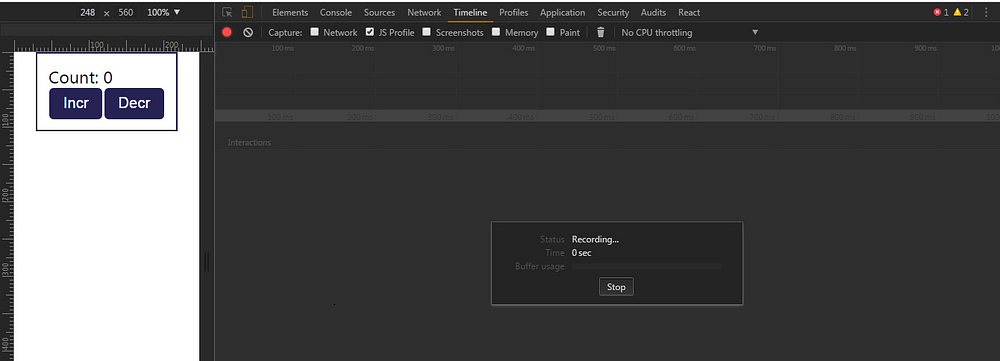
When done, click on “Stop” button.
The tab will load the timeline.
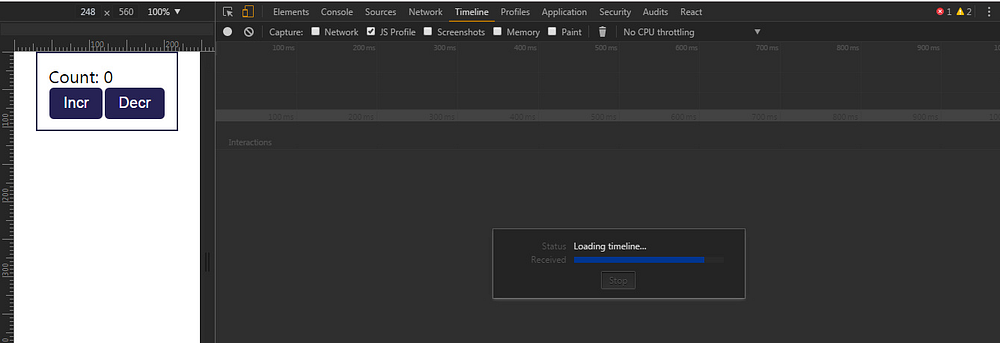

We can select an area of interest in the overview by dragging. Then, zoom and pan the timeline with the mousewheel and WASD keys.
I used the Counter app I built as a demo here:
class Counter1 extends React.Component {
    constructor(props) {
        super(props)
        this.state = {
            count: 0
        }
    }    render() {
        return (
            <div className="counter">
                <div>
                    Count: {this.state.count}
                </div>
                <div>
                    <button onClick={() => {this.setState({count: this.state.count + 1})}}>Incr</button>
                    <button onClick={() => {this.setState({count: this.state.count - 1})}}>Decr</button>
                </div>
            </div>
        )
    }
}class App extends React.Component {
    render() {
        return (
            <Counter1 />
        )
    }
}
I needed to record the timing of the app from where it loaded and when I pressed the Incr and Decr twice. So I pressed the Record button, and I loaded the app, then I pressed Incr once and Decr once.
Here is the timeline report.
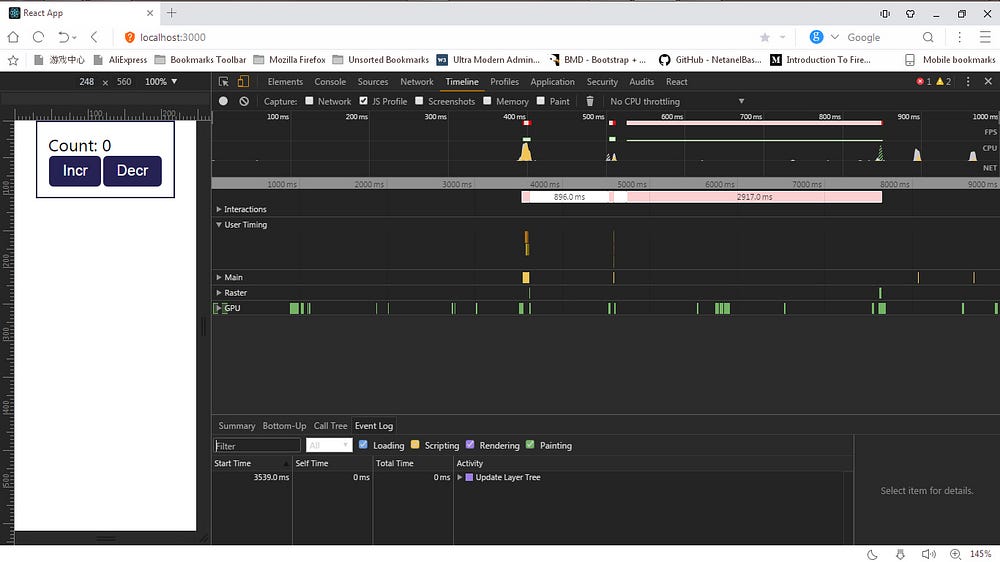
Zooming in on the report using the W key.


Each orange-colored bar represents a component process. You’ll find the component name, as well as the life-cycle method taking place, listed within each of the bars. In our pic, we see that the App and Counter1 has [mount] in their bars, this indicates that they are being mounted for the first time in the DOM and also with the indication of how long it took.
Moving through the timeline, we come across the timeline for the Counter1 update when we pressed the Incr and Decr buttons:

This is for the Incr button press. The action re-rendered the Counter1 component, that’s why there is an [update] there. It took 24.00ms to update the Counter1 component.

This is for the update of the Counter1 component when the Decr button was clicked.
Each time a component renders, a new row is added to the graph. If something caused a component to rerender multiple times, this graphical representation makes it much easier to diagnose. It also keeps an eye on how long each component needs to render. The longer the row, the longer a component takes to render. Use this feature to profile different pages of your application and see if anything stands out as particularly problematic.


